The Reporting module in Labstep allows you to analyse and compare experimental data with ease. Whether you're tracking protocol performance across multiple experiments or comparing data fields measured by different protocols, this feature helps you extract meaningful and key insights from your research all in one place. Once set up, you can customise reports by selecting relevant columns, filtering data, and saving views for easy access. Ready to dive into your data? Let’s get started!
The first version of the reporting module supports two modes for slightly different use cases:
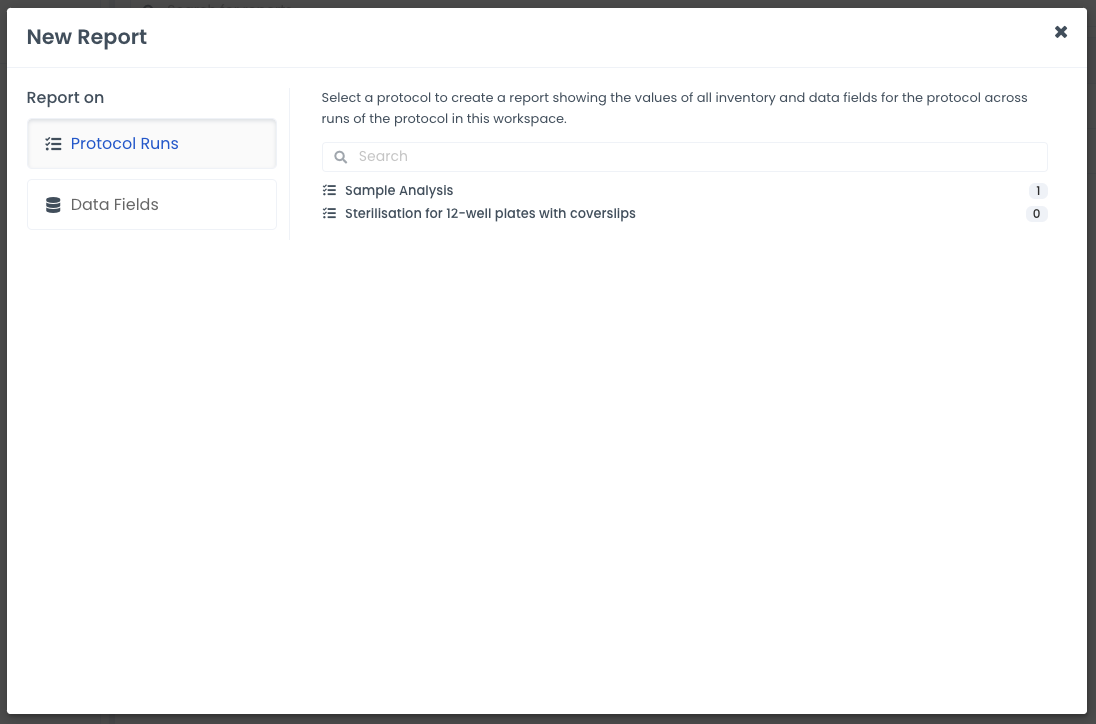
This mode allows you to compare data generated by the same protocol across all the experiments and experimental conditions you've run it under.
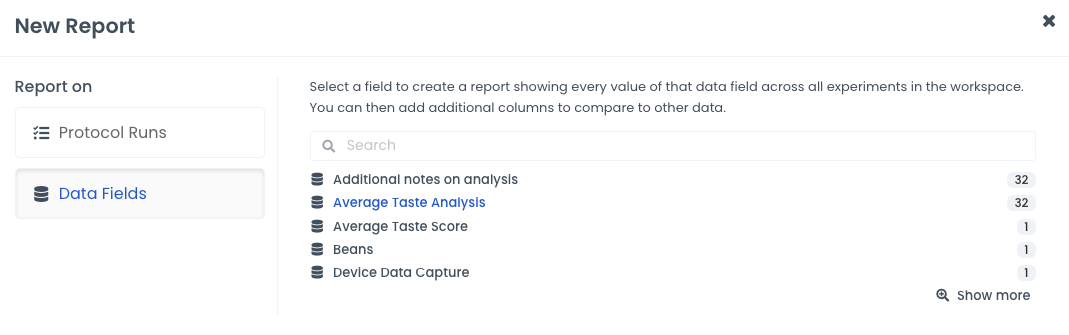
This mode is designed for if you have the same data field measured by different protocols and want to compare across all measurements. It can also be used if you have data/inventory fields directly on experiments on experiment templates that are not associated with a protocol.
Before getting started with Reporting on Labstep, it is important to ensure your protocols and inventory are set up correctly.
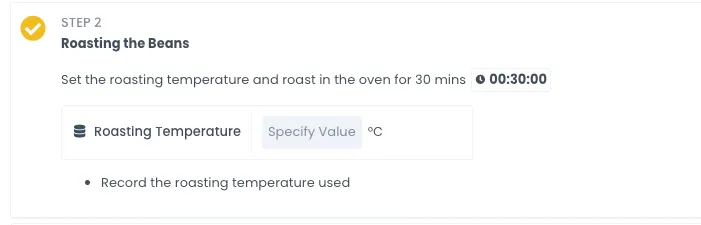
If there are important results you want to be able to compare in a report such as the Yield, Efficiency or Average Response, you need to ensure these are added as structured data field fields on your protocol or experiment template.
Note: if you are measuring the same variable in different protocols and want to be able to compare them in a report, make sure you use the same name when adding the data field.
If your protocol involves creating new samples, ensure they are captured with an Output Inventory Field on your protocol/experiment template. Ensure any properties of the sample produced that you want to compare are added to the Resource or Item Template in the category settings.
There may also be parameters and other inputs you will want to compare in a report to determine the factors affecting your results. You must also ensure that any parameters you want to track are tracked in data fields and any input inventory as inventory fields. This will allow you to see how the amounts, batches and properties of the inventory used affect your output results in any way.
If your protocols and inventory are set up with the fields you want to track, you are all set to start reporting on your data.
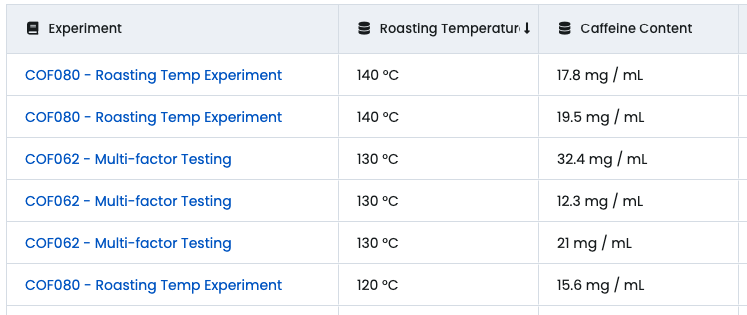
When you select a protocol to compare data for, a table will appear, with each row representing a different experimental condition under which the protocol was run. Similarly, if you select a data field to compare, the table will show every experimental condition where that data field was defined.
What this means is that if you run basic experiments where you just have one sample you are testing or creating, it will appear as one row in the report.
However, if you use a ‘Variable’ field or insert a ‘Conditions Table’ you may have multiple conditions within the same experiment, representing different samples, or different concentrations or other factors you might be testing within the same experiment. For more information about Variables and Conditions, check out this help article.
In this case, each of these conditions will appear as it’s own row in the report.
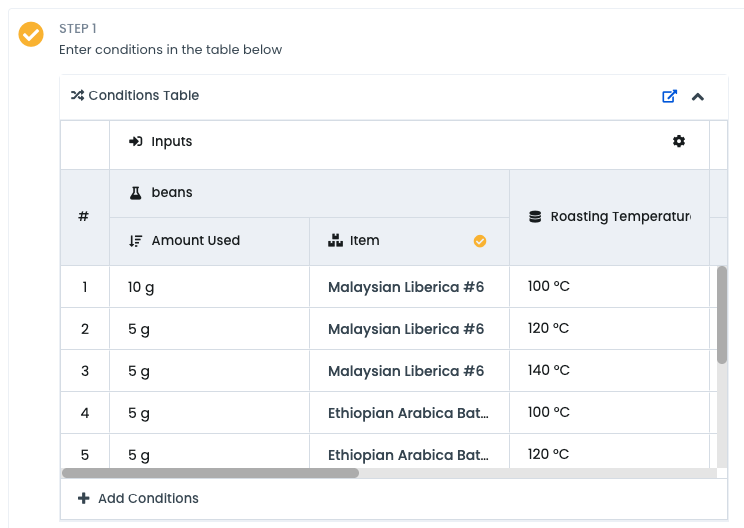
This allows you to compile and compare all the different conditions across all experiments. Basic experiment runs with no variables or conditions table can also be compared in the same report, they will simply appear as a single experimental condition.
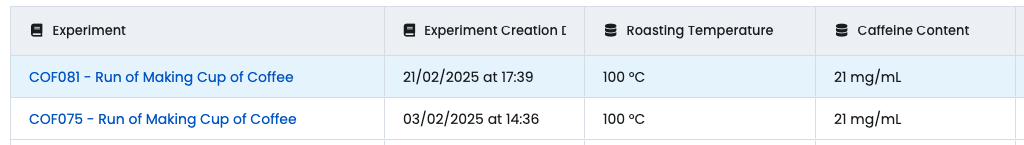
The report will be initialised with some default columns depending on the type of report. However, these can be customised by clicking the 'Columns' button.
This screen allows you to rearrange the columns or hide columns you don't care about.
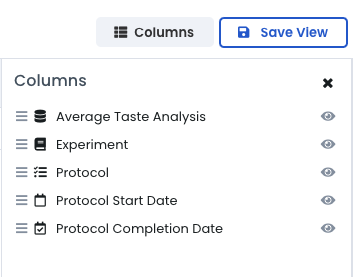
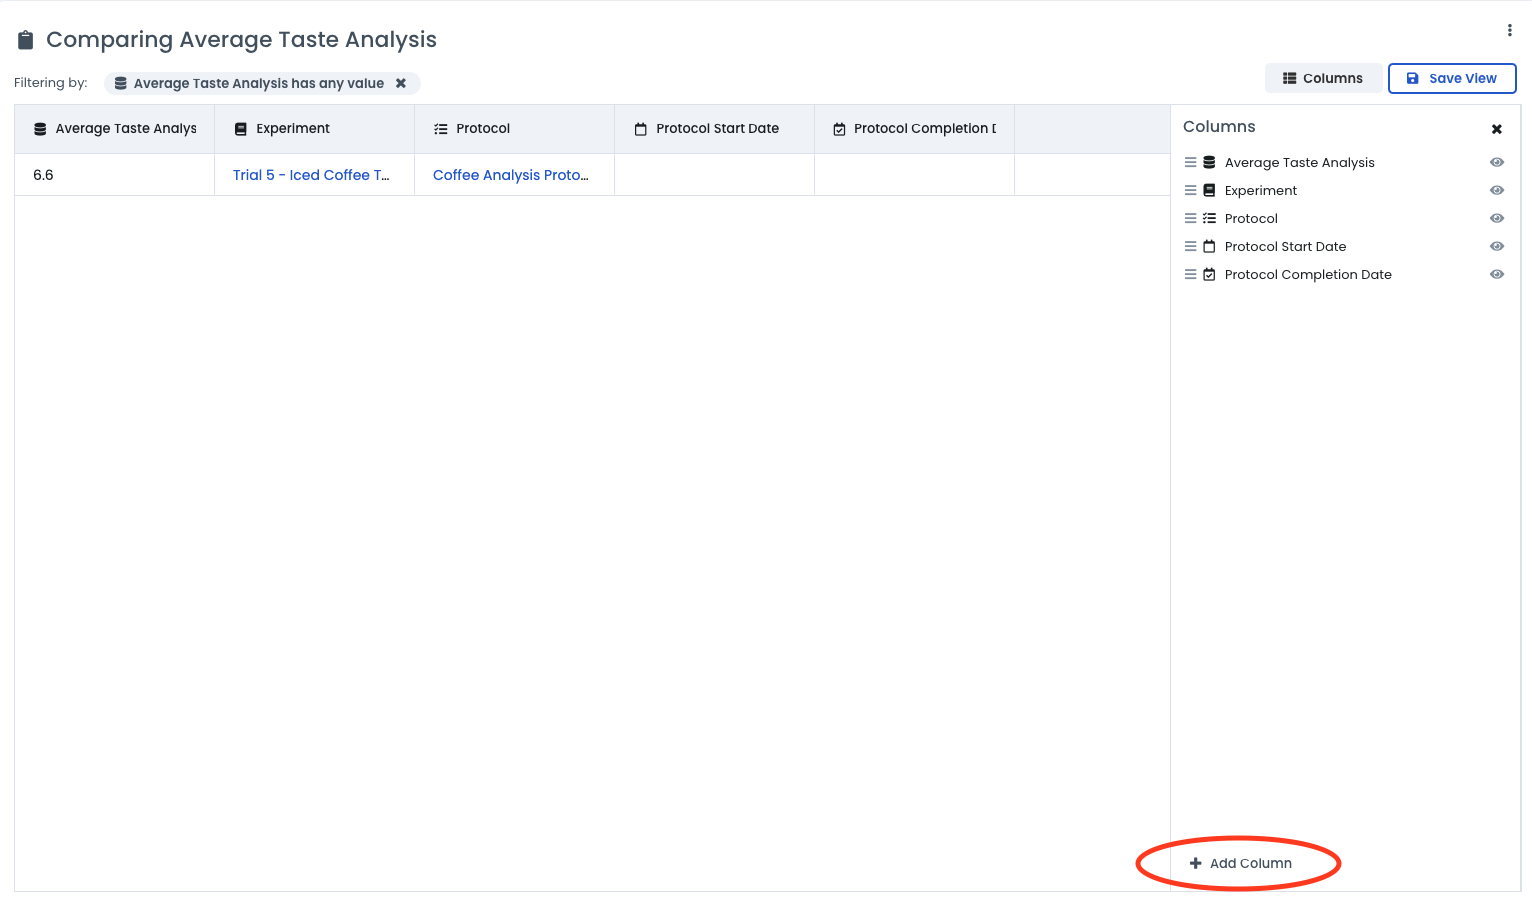
To add further columns, simply click 'Add Columns'
Here, you can add some basic columns, such as the dates the experiment/protocol was started and completed, the current status, who created the experiment, etc.
You can also search for any data or inventory field defined in your workspace. For inventory fields, you can then customise further which columns you want to see. For example, you may want a column for the amount used in each experiment, the specific item used, or maybe some property such as the Lot number or type.
Note: if an experiment in your report does not have the selected data/inventory field, the cell will simply appear blank.
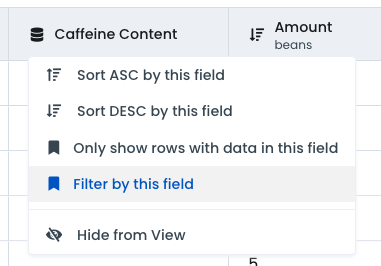
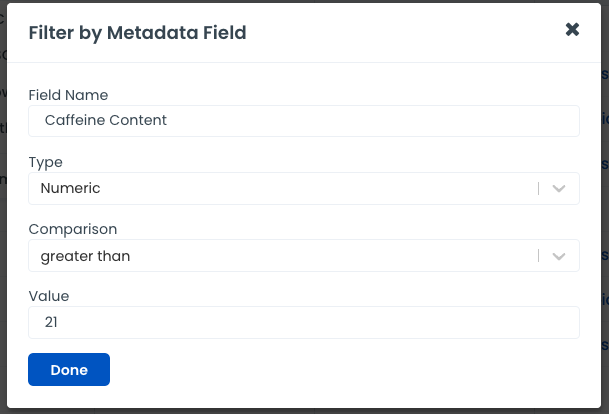
Once you are happy with your columns, you can sort or filter the results by clicking on the column header. It is often useful to filter for experiments created within a certain date range or where the value of a data field falls within some desired range.
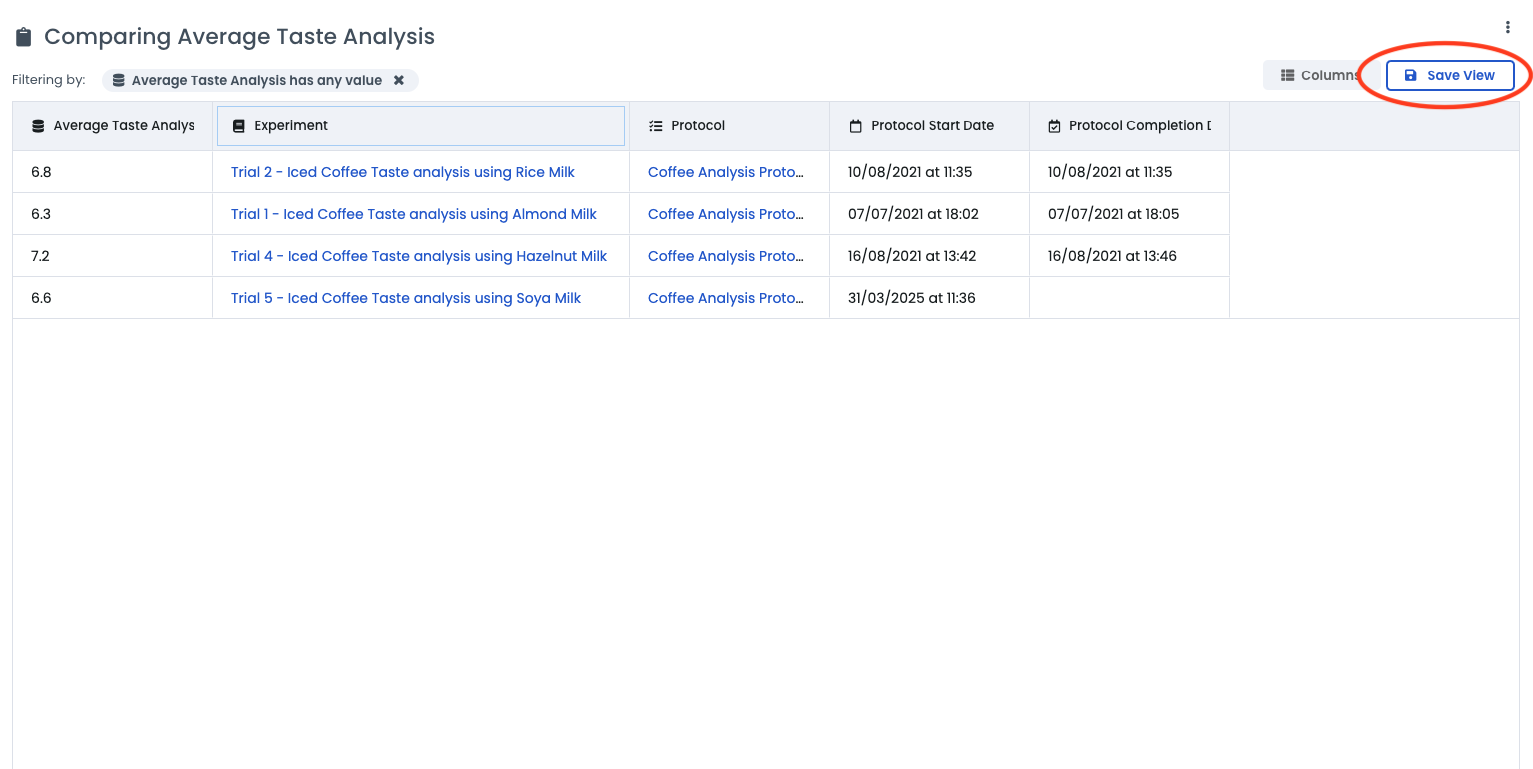
Once you have finished customising the report, remember to click 'Save View' so that your columns and filters are saved for the next time you want to revisit the results.
Ready to get started and make data-driven decisions to optimise your processes? Get in touch now to unlock the reporting module via the in-app chat or by emailing us at [email protected] 🚀
Still need help?
Contact us here or start a conversation with a member of our team using our in-app chat.
